Plesk has a versatile and easily accessible log viewer. Perform the following steps to access the log viewer and filter the entries.
# Steps to access the Plesk Control Panel
1. Log in to Customer Portal.
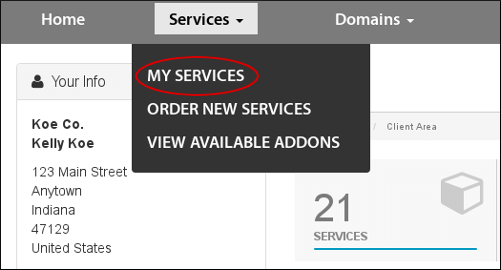
2. Click on the Services menu, and select MY SERVICES :
3. Click on Manage, present to the right side of the desired hosting package.
4. On the tab for Hosting Information, click on Open Control Panel.
# Steps to View the Logs
Perform the following steps to view the logs :
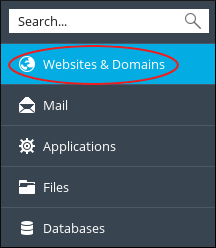
1. In the left sidebar of Plesk panel, click on Websites & Domains
2. In case you have more than one domain on the server, scroll to the management area for that domain and then click on Logs
Logs page will now appear and it shows the most recent activity.
3. Logs page will by default show all the available logs. Plesk also provides different types of logs depending on the platform.
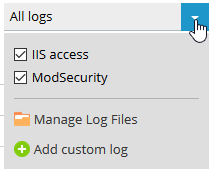
We have shown here the IIS access log and the ModSecurity log for Windows.
In order to choose the log or logs to view, click on the drop-down arrow present on the right side of the All logs section, and then select or clear the checkboxes.
# Steps to Filter the logs :
Filtering logs can be done by Date, visitor IP address, HTTP status code or HTTP message
1. To filter logs by Date, click on the down arrow situated to the right of the Form field. Using date and time controls you can select the oldest date that you want to make visible in your results. Click on Apply once you are done.
In the example shown above, the entries from 2017 and after will be shown. Click on Clear button, if you want to remove the data filtering.
2. To filter logs by visitor IP address, type all or some part of IP address in the IP text box. When you type part of the IP address, a log entry will show results if any part of the IP address matches with the entry. As shown in the below example, 10. matches with 10.1.1.1 and also with 192.168.210.1
3. To filter logs by HTTPS status code, type all or some part of the status code in the text box. When you type the part of the code, log entries will be shown as per the match of the status code. As shown in the below example, 5 matches with all of the 5xx Server Error Codes, but it also matches with codes 505 and 605.
4. To filter logs by HTTP message, type all or some part of the message in the Message text box. When you type the part of text message, log entries will be shown if any part message matches the entry. As per the example shown below, POST is followed by space and forward slash which helps to limit the filtered entries to POST messages. If space and forward slash are missing, then every entry containing the string post will be shown in the results.
Note: By combining all these filters criteria can help you to achieve the exact desired result.
# Steps to view the most recent data
There are two methods in the Log page to view the most recent data :
1. To update the view continuously as new visitors can browse the site at any time. Click on Start real-time updates present at the upper left part of the Logs page. The caption on the button will change to Stop real-time updates. Inorder to stop some real-time updates, click on Stop real-time updates.
2. Click on Refresh in order to update the log display with the latest information without continuous updates.
Read more :
2) How to Upload the Content to the Plesk Server with File Manager?


