With Launchpad, you can see the server statistics of your VPS hosting dashboard.
To Check your Server’s Statistics from Launchpad Dashboard
1. Log in to your Launchpad account.
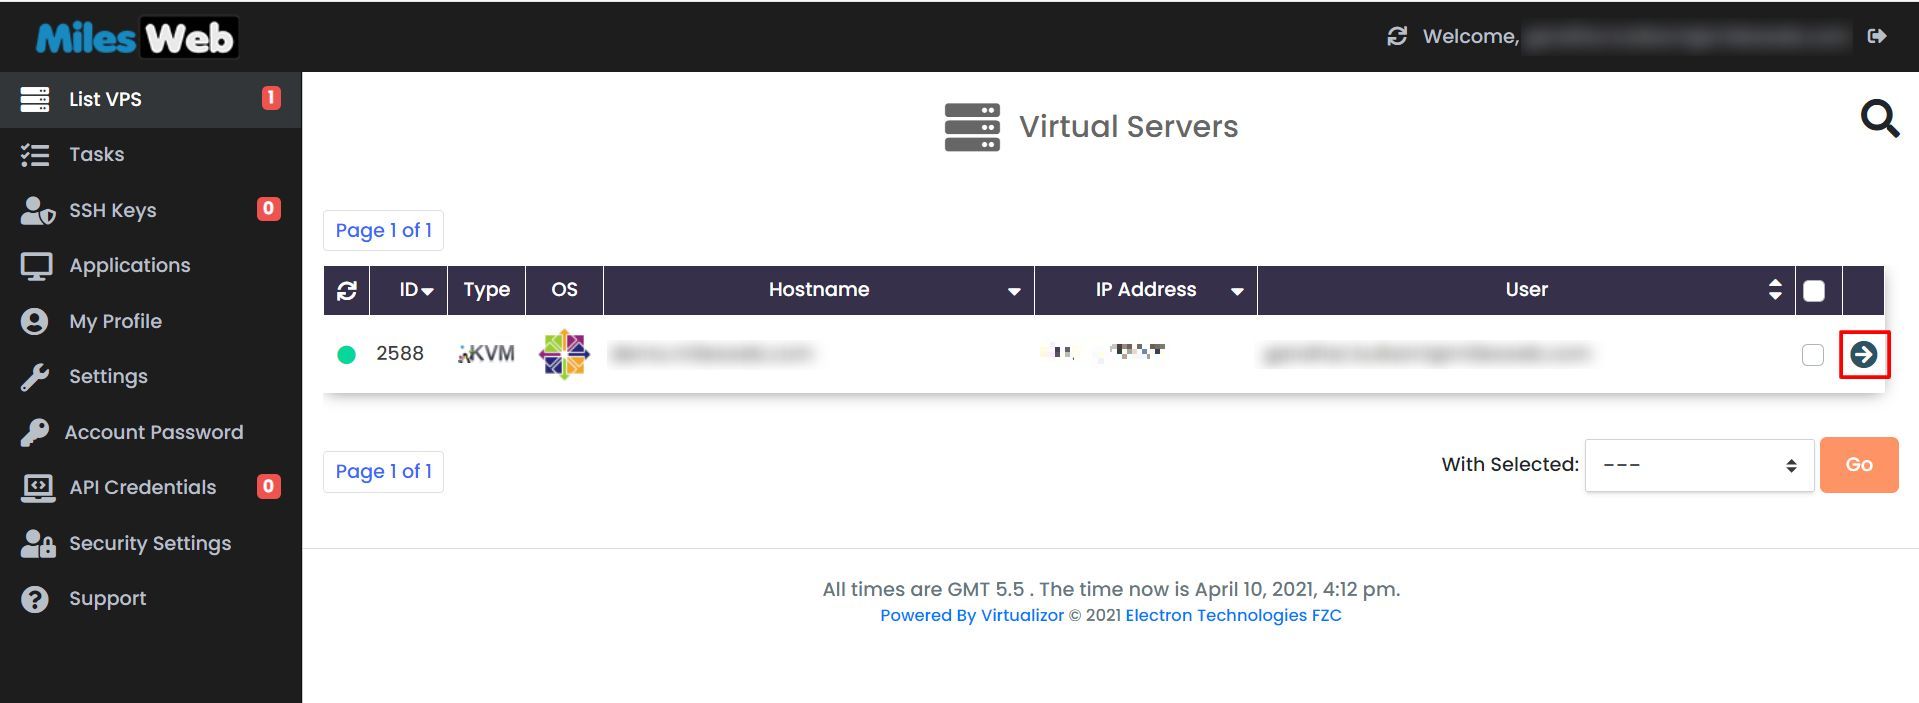
2. Click on the arrow beside the server name.
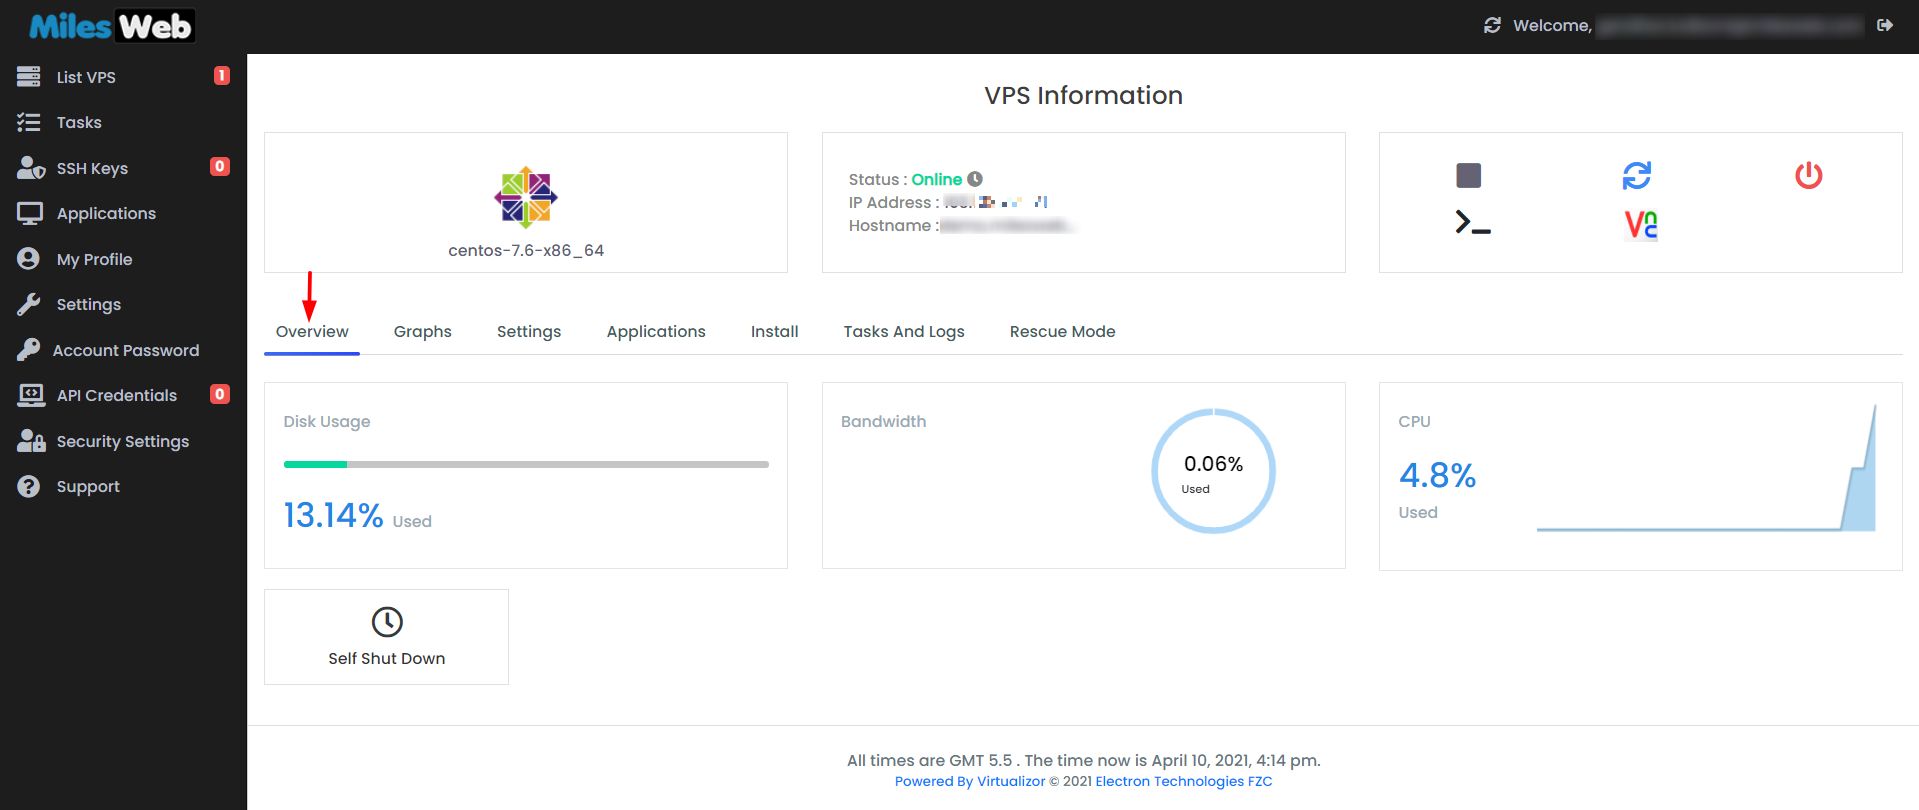
 3. It will open the VPS Information page. Here, you can see the basic info of the server and a few options like Overview, Graphs, Settings, Applications, etc.
4. In the Overview, you can see the Disk Usage, Bandwidth and CPU Use in the form of informatics.

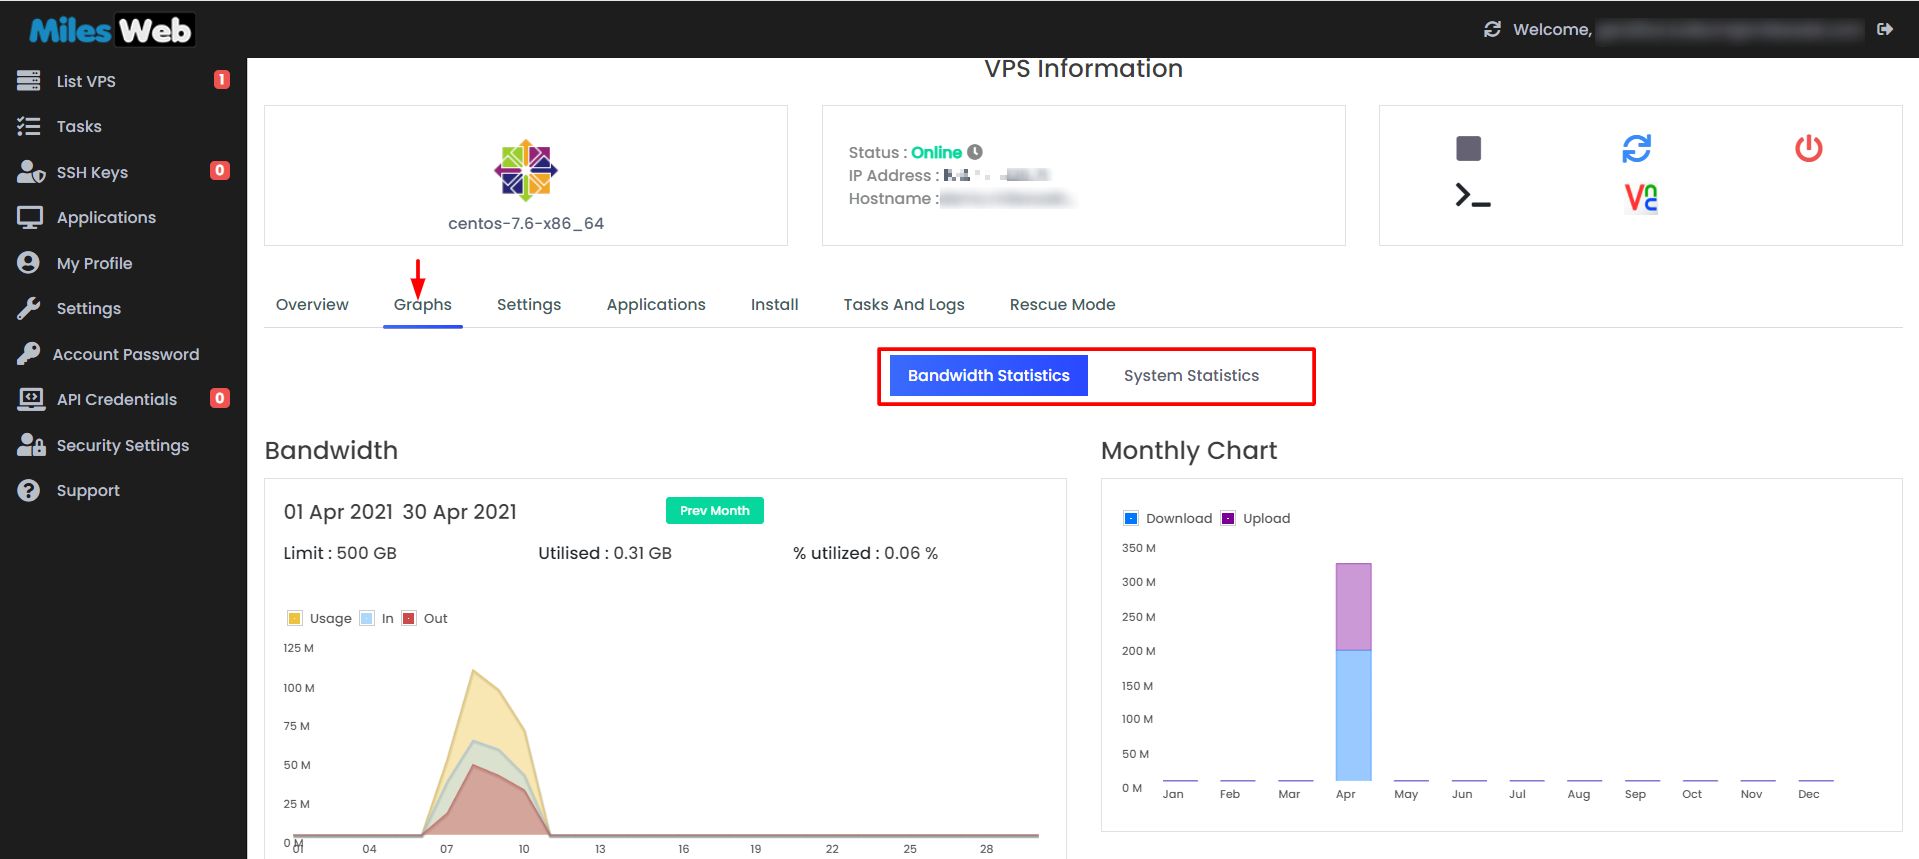
5. Similarly, if you go to Graphs, you can choose to see different graphical statistics by choosing Bandwidth Statistics or System Statistics.

You can also find other information about the server aside from the statistics as you explore other options.


