It is crucial to keep track of the resources your Windows server uses. Most of the time, identification of high load causes and proper utilization of resources does solve the whole slugging issue. It is important to remember that the server can get overworked due to several reasons, but rest assured, Windows has tools built into it to keep track of these resources. In this article, we will check out the four different methods that can be used for monitoring a system’s resources in the Windows Server OS.
Method 1: Task Manager
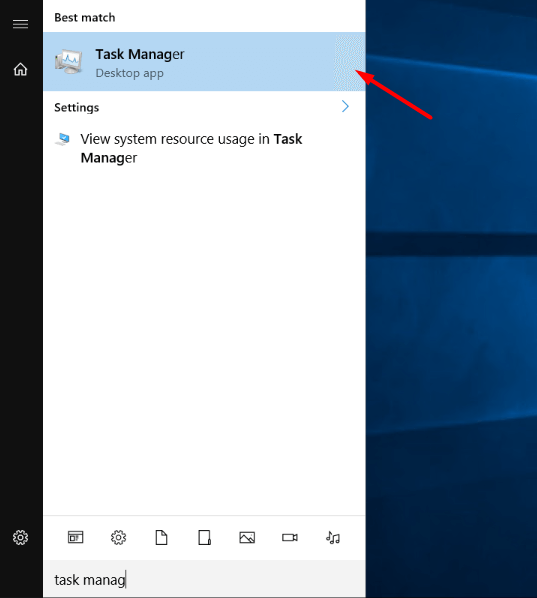
The first tool, i.e., Task Manager, can be opened by searching for it on Windows after signing in. It displays processes currently being used by every open application, users of the application, and their memory consumption alongside the CPU.
Steps:
1. The first step is to search Task Manager on your Windows server.
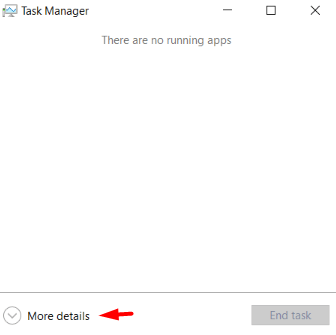
2. Now expand the view by clicking on More Details.
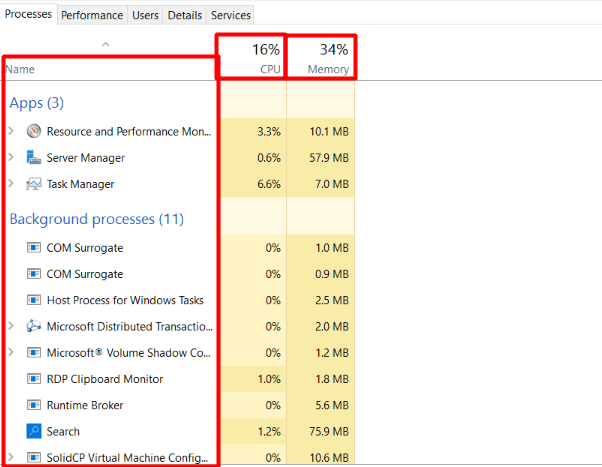
3. Now in the Performance Tab, you may monitor over pen points, including:
- CPU: Monitors real-time CPU load consumption utilized by an application
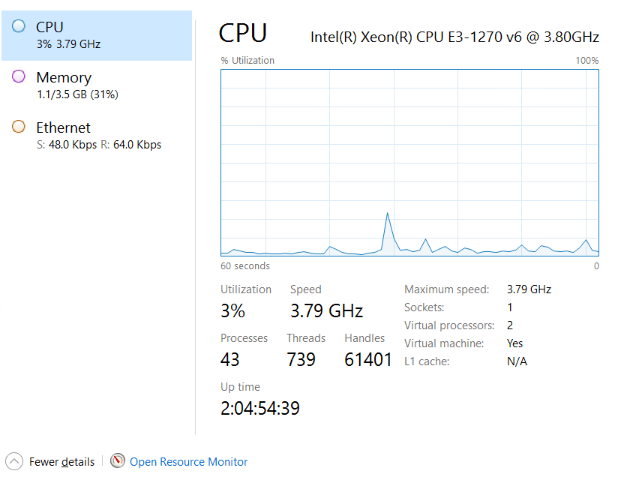
- Memory: Monitors real-time RAM usage of all running processes within a given period.

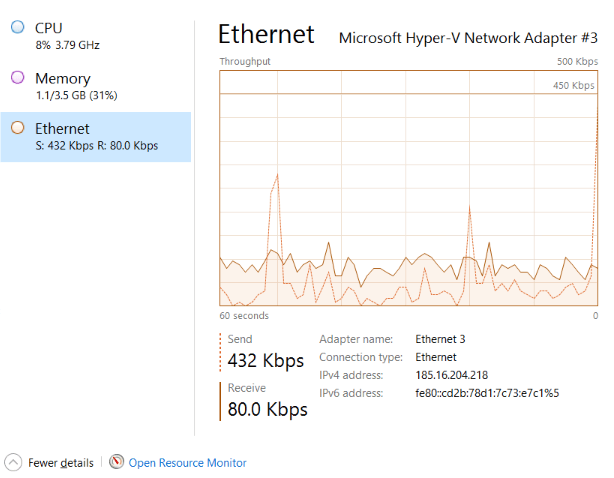
- Ethernet: Real-time tracking of bandwidth consumption of your network adapter.
4. Clicking on each of them enables users to visit the Processes tab and gain insight into what resources are utilized currently by every application.
Method 2: Resource Monitor
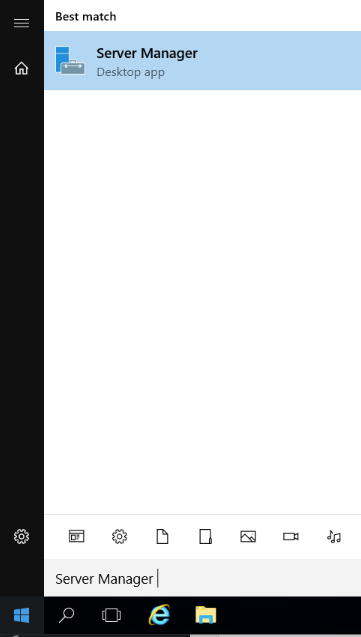
Use the search bar to look for Server Manager and launch the application to move toward the second tool on our list.
Steps:
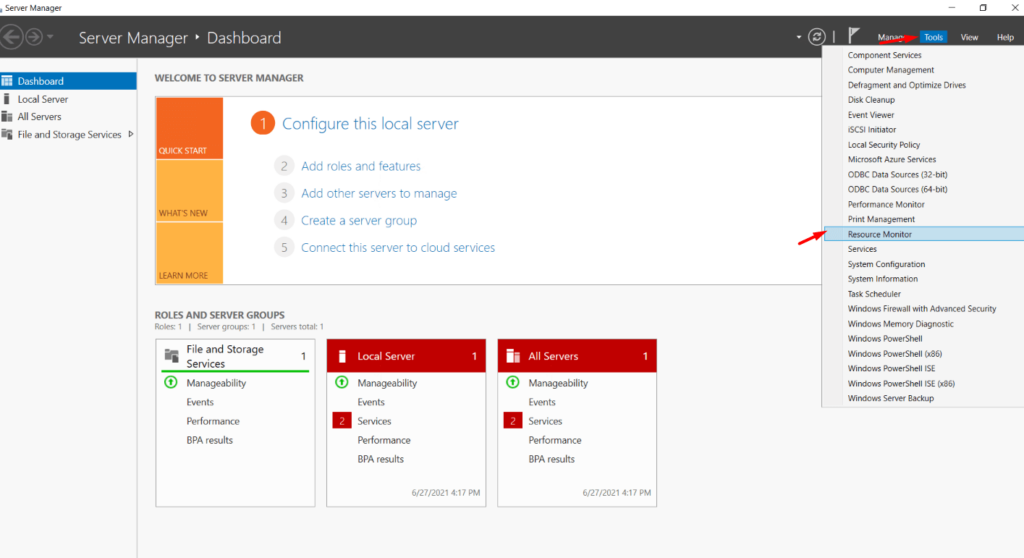
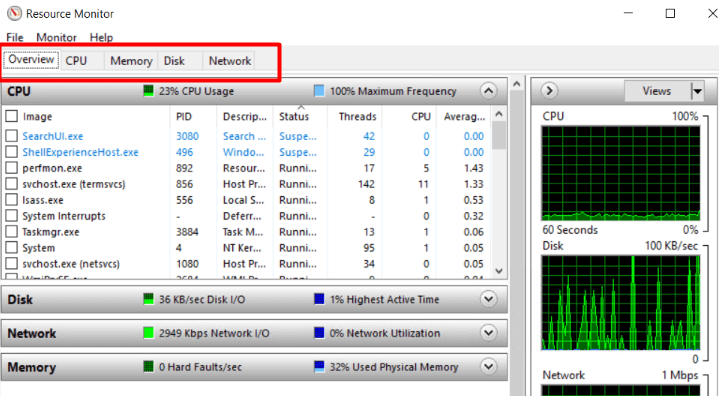
1. Open the “Server Manager” application in Windows by searching for it and opening it.
2. The next step is to go towards Tools and on that heading you will see Resource Monitor.
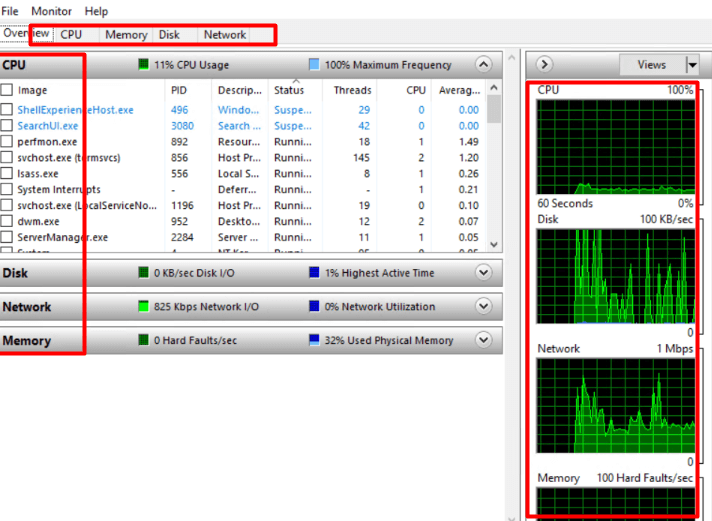
3. In a manner akin to the Task Manager, the Resource Monitor also displays real-time information on the following metrics:
- Central Processing Unit
- RAM
- Disk Space
- Networks
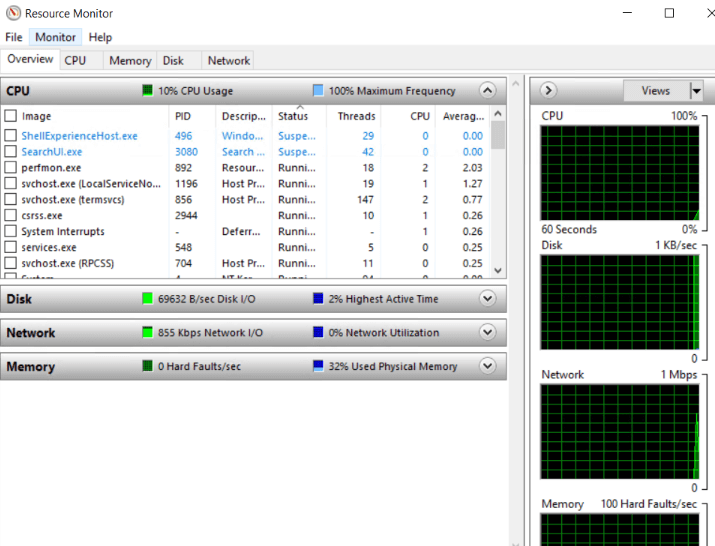
4. As for the ‘Overview’ section, it contains real-time graphs for the CPU, RAM, network, and disk I/O.
5. To analyze specific resources, use the designated tabs at the top:
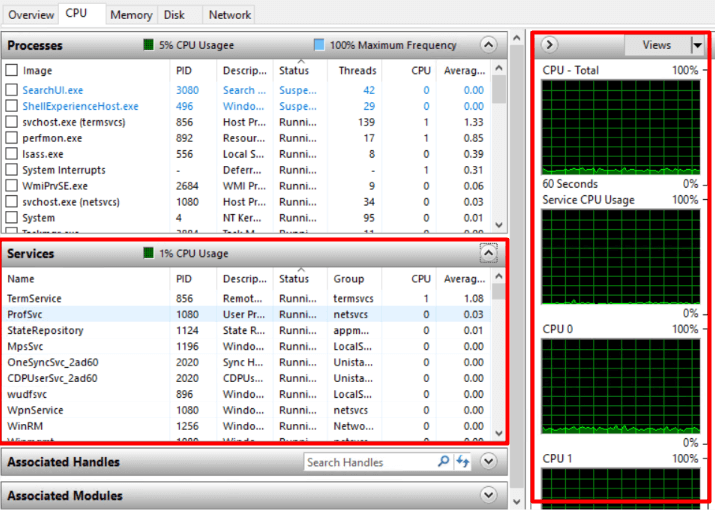
- CPU: Displays all processes that are active in terms of consuming the CPU, their status, and the execution unit of every executable.
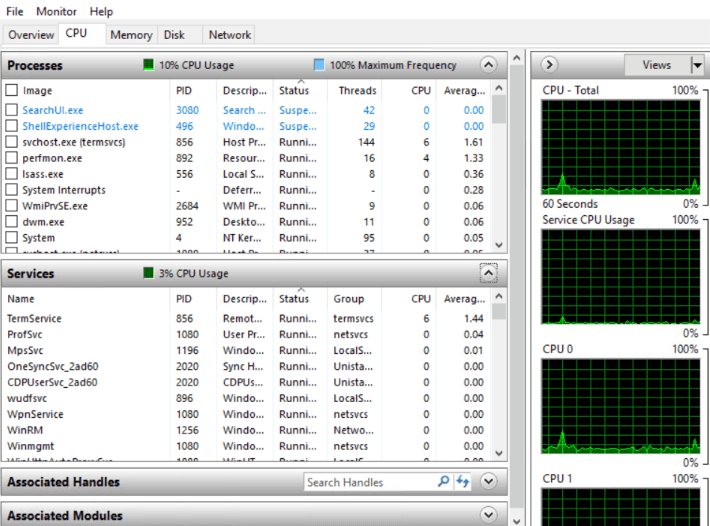
Additionally, you can monitor CPU activity via graphs and view the usage of services under CPUs.
- Memory (RAM): Displays all memory metrics in real-time that every single active process requires, as well as detailed ones like:
- Status: The state of the process, whether running, active, or suspended.
- PID: The unique ID that is assigned to each process.
- Hard Fault: The average amount of hard page faults in the span of a second over the last minute.
- Commit: The virtual space that was allocated to the process.
- Working Set: Currently allocated physical space that is being used.
- Shareable: The physical space that has been allocated and used by other processes.
- Private: The physical memory that has been allocated and is solely used by the process only.
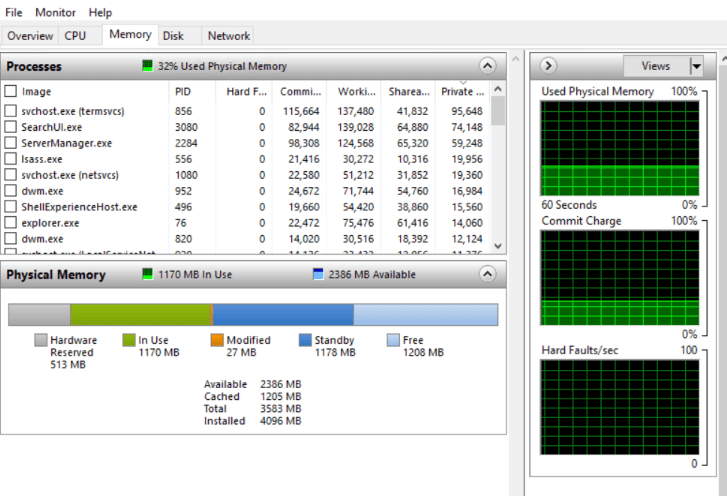
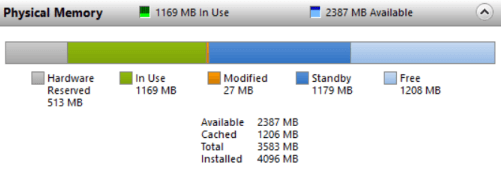
Besides the ones mentioned above, hardware-reserved memory, in-use memory, modified memory, standby memory, and free memory can also be tracked.
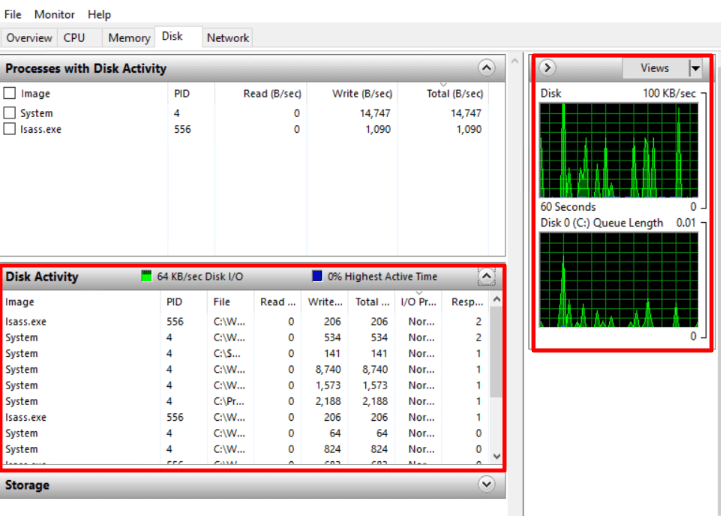
- Disk: Active disk processes that are using up resources, their current status, their ID, and metrics such as these are listed:
- Read: Average number of bytes being read from the storage space over a second during the last minute.
- Write: Average number of bytes written every second in the past minute.
- Total: The second in total number of bytes being accessed into the disk.
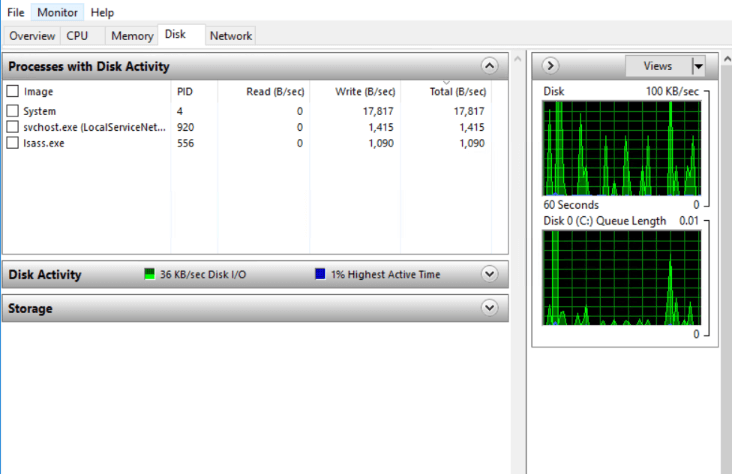
Through the use of graphs, disk activity can also be displayed.
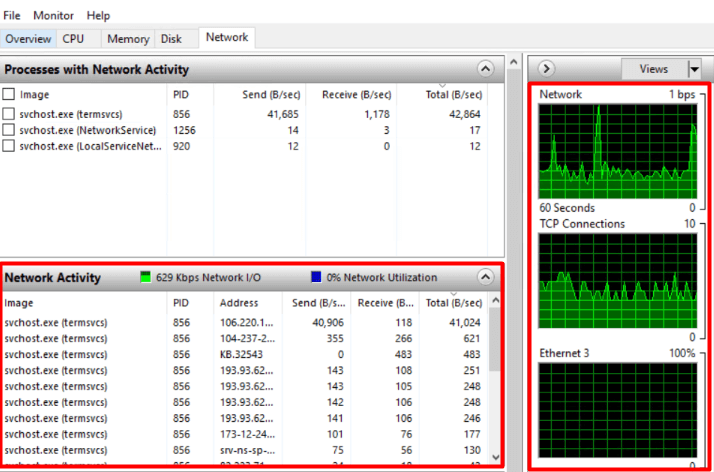
6. Network: Processes that are actively using the network with their name, the unique identification number, and the metrics that are used, which are
- Send: The number of bytes that are being sent each second at the last minute.
- Receive: The number of bytes that are being obtained every second within the last minute.
- Total: Network usage combined.
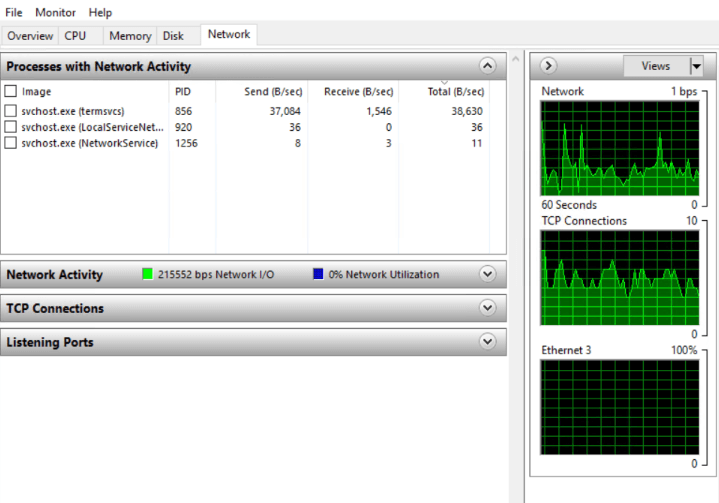
Graphs enable you to monitor the real-time usage of the network and the network activity tab allows you to keep track of your network activities.
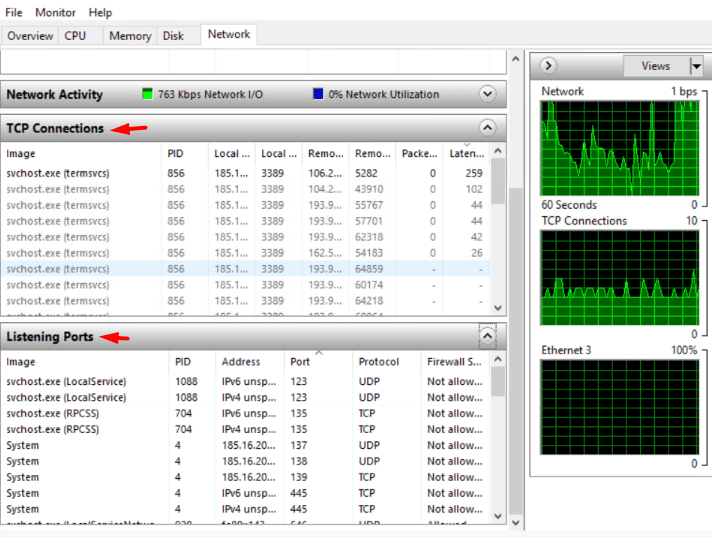
You can also track TCP Connections and Listening Ports from there.
Method 3: Opening Performance Monitor (on Windows)
Performance Monitor offers real-time system resource usage tracking, including insights into CPU and memory usage and disk I/O and network traffic. You will then be able to use these critical metrics to analyze bottlenecks, optimize performance, and proactively head off potential problems.
Steps:
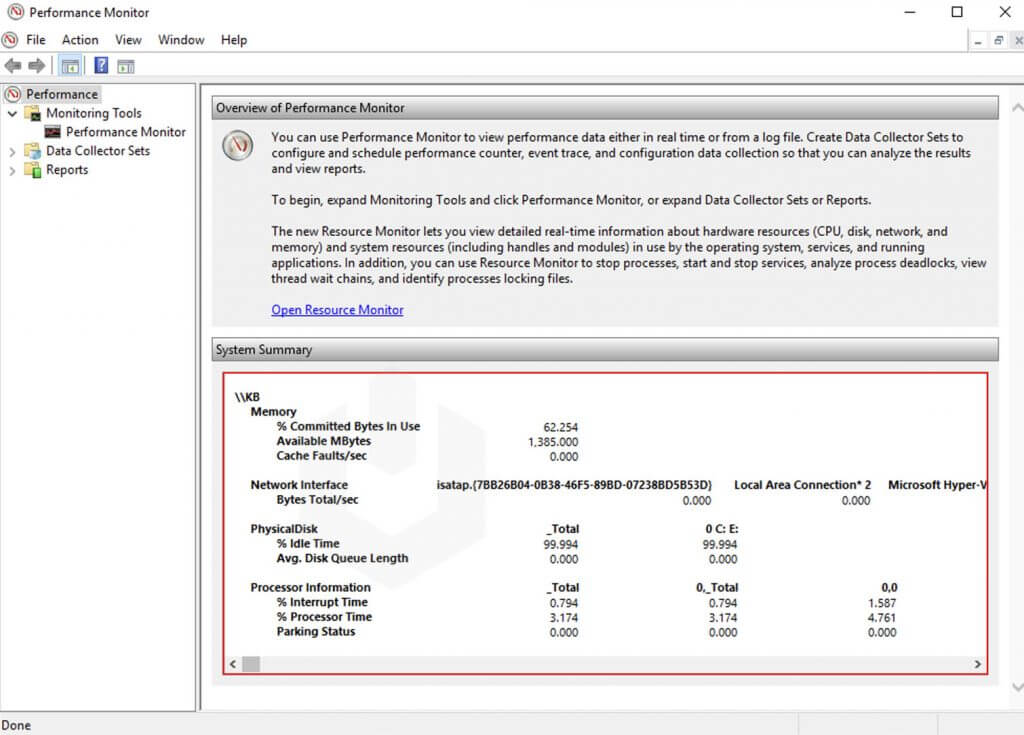
- Turn on Windows, type in “Performance Monitor,” and start it up.
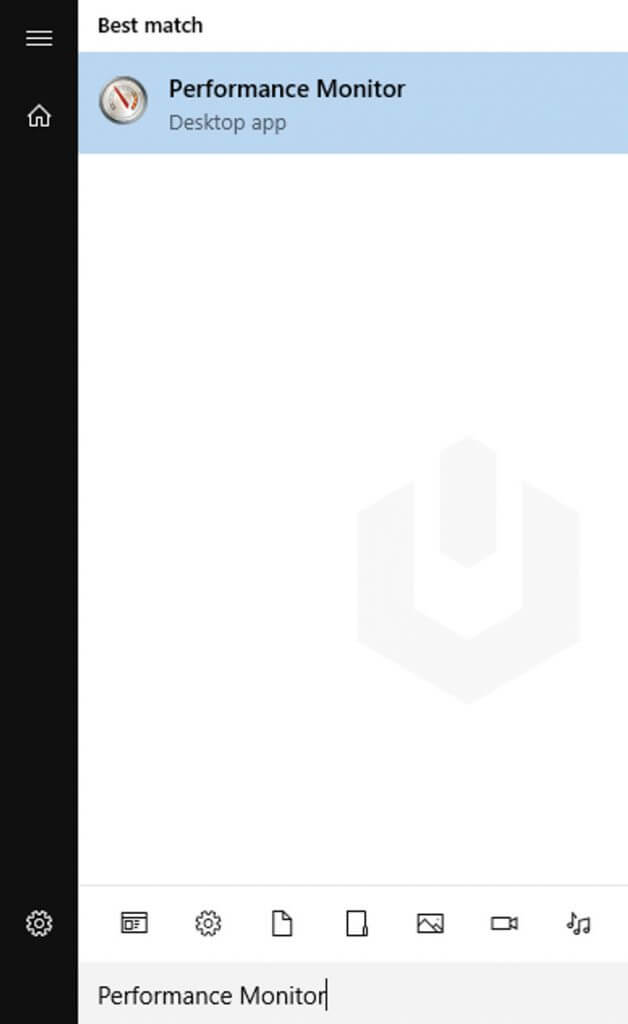
- The Performance Monitor tool depicts the real-body usage system, including physical memory, disk space, network activity, and processor usage statistics.
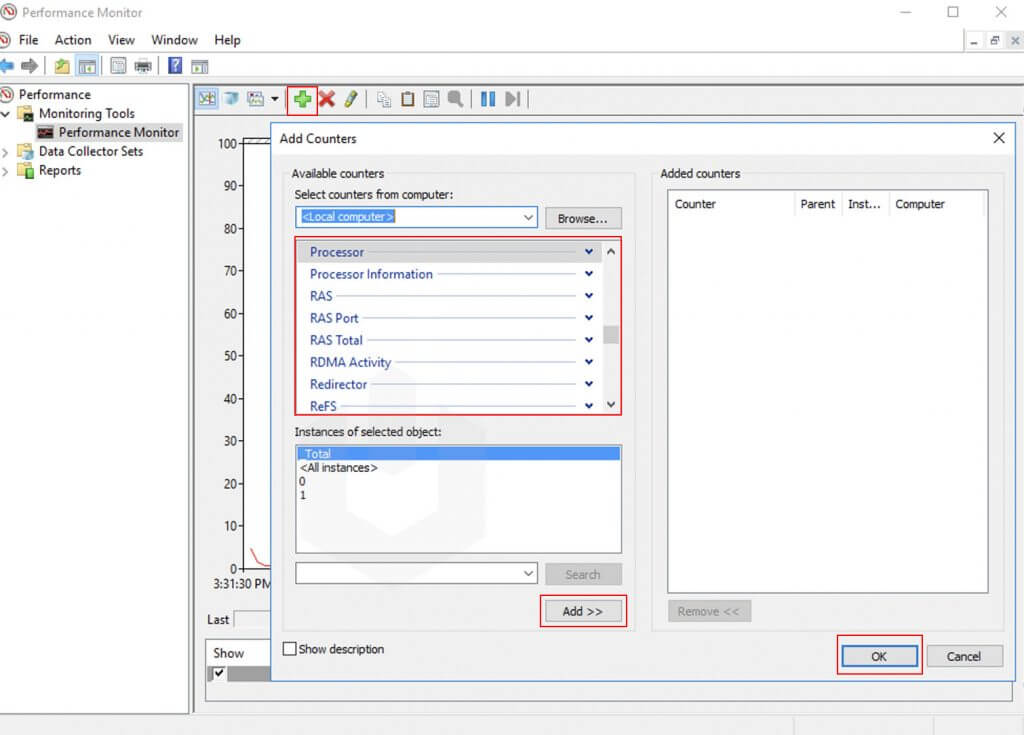
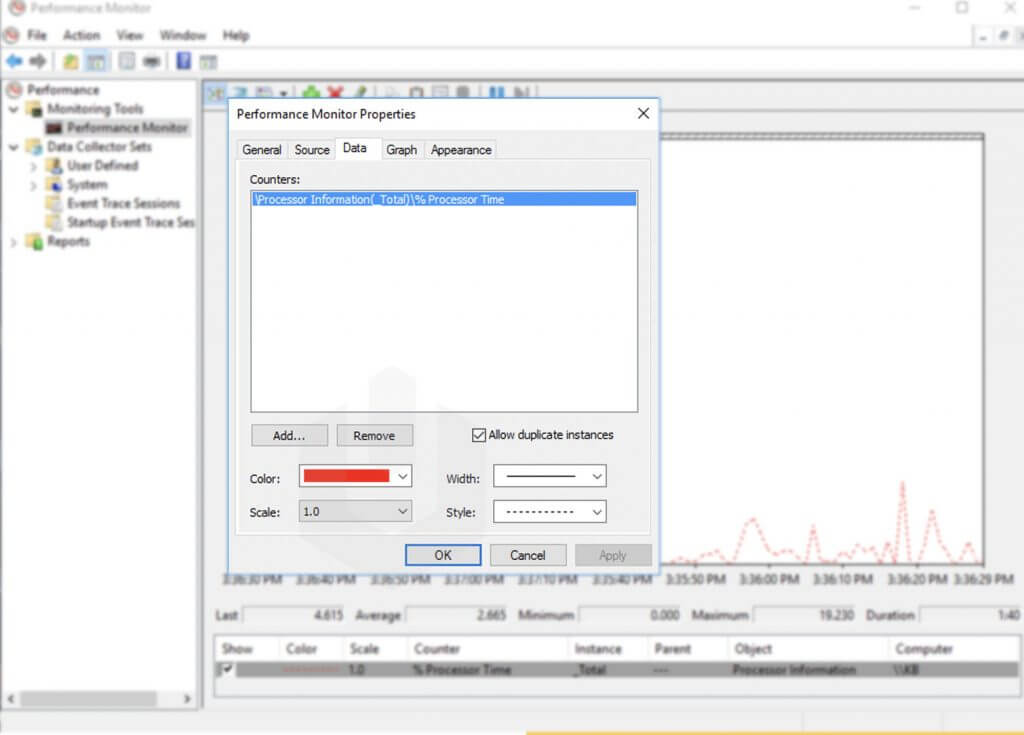
- Continuing through the navigation options, there is the Processor Time Counter, which keeps tabs on the amount of system resources used in the last 100 seconds.
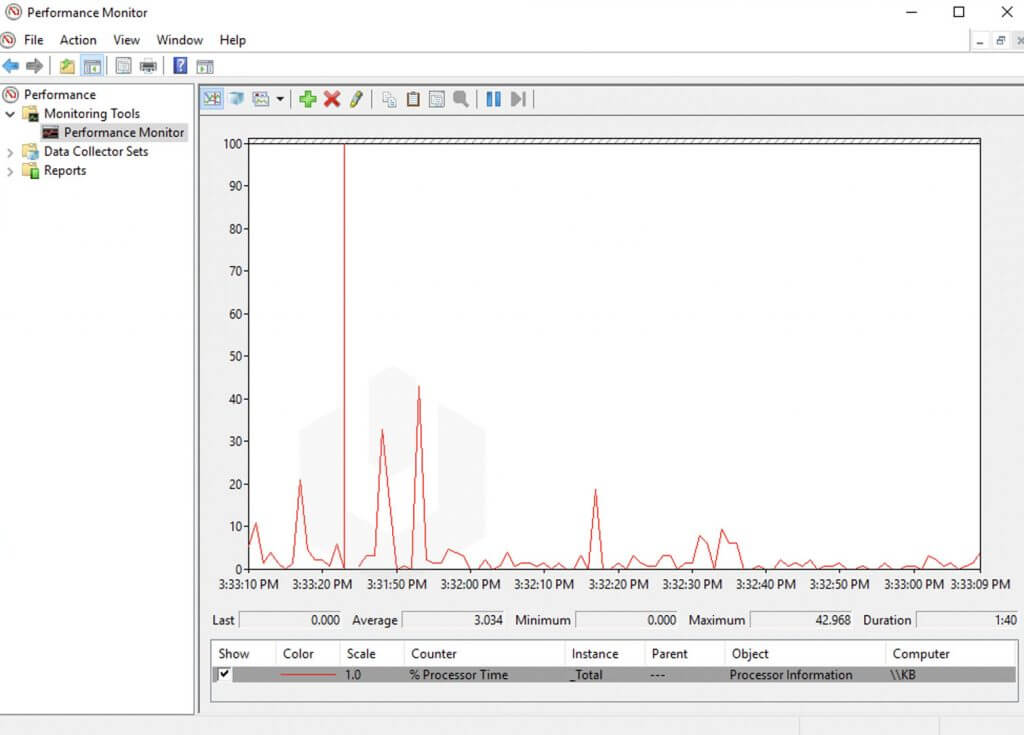
It also allows you to track other objects and the different graphics capabilities of Windows to combine them.
To change the graph or monitoring visuals, simply right-click on the interface and click Properties.
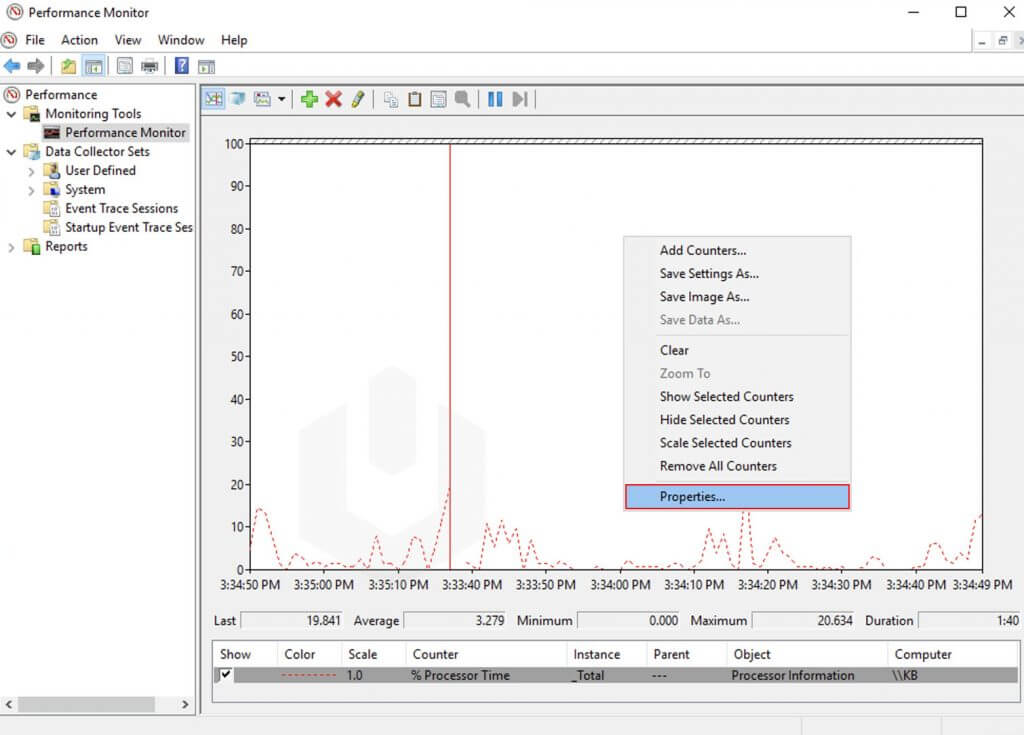
Through the Properties panel, you can make changes to the data, display styles, and even the Performance Monitor interface.
By using these four methods, efficient ways to supervise and change the use of resources on a Windows Server are provided, guaranteeing an effective balance of the load to and overall performance of the system.
With the Task Manager, Resource Monitor, Performance Monitor, and external programs such as Hyonix, administrators get a complete picture of what happens in the system. These tools not only provide knowledge of processes that consume resources but also allow for changes to be made on the go.
Continuously monitoring resource usage helps eliminate bottlenecks, reducing downtime and keeping the server healthy, leading to better reliability and efficiency.


